
The Semiconductor Sector: 7 Indicators Beginners Should Check
Read semiconductor news or brokerage materials and unfamiliar indicators come pouring out. Sentences like "DRAM contract prices rebounded," "utilization fell," or "the SOX surged" are typical. Each of these indicators illuminates a different piece of the semiconductor landscape. That said, it's hard to declare "things are good or bad right now" from any single indicator. This article lays out only how to interpret what each of seven frequently appearing indicators means and how to read it. It is not an article that predicts the direction of any particular stock or recommends trades.

1. DRAM/NAND Contract Prices: The Thermometer of Memory Conditions
Memory chip prices are broadly divided into contract prices and spot prices. The contract price is the price manufacturers and large customers negotiate on a periodic basis, while the spot price is what trades in the market at any given moment. The one that directly affects large memory companies' earnings is generally the contract price. The key to interpretation is direction and trend rather than the absolute figure. When the contract price rises for several consecutive quarters, it's generally read as a signal of improving conditions, and when it falls, as a signal of slowdown. The spot price tends to move ahead of the contract price and is sometimes viewed as a "leading reference," but because it's highly volatile, be careful not to overreact to short-term swings. Also, because DRAM and NAND differ in their applications and supply-demand structures, they can show different trends, so it's best to look at each one's direction separately rather than lumping the two product groups together.
2. Inventory: How Much Is Piled Up
Inventory shows the balance of supply and demand. When inventory piles up excessively, it becomes pressure that pushes prices down, and when it falls to a normal level, it lays the groundwork for price stability or a rebound. That's why the phrase "inventory adjustment is in its final phase" appears in the news. That said, inventory includes not only manufacturers' inventory but also customers' (set makers') inventory, so you have to read which stage's inventory it is. Inventory itself isn't bad; the key is to look together at "whether the direction is increasing or decreasing."
3. Utilization Rate: How Much the Plants Are Running
The utilization rate indicates the degree to which production facilities are operating. When conditions are poor, companies try to defend inventory and prices by cutting production (reducing output) to shrink supply. So a fall in utilization is not necessarily only a negative signal; it can also be interpreted as a signal of supply adjustment. Conversely, when demand revives, utilization recovers. Utilization only makes sense when read together with the inventory and price indicators.
4. The Philadelphia Semiconductor Index (SOX): The Temperature of Global Sentiment
The SOX is an index that bundles the major semiconductor companies listed in the U.S. It's often cited as a reference indicator for gauging the market's investor sentiment toward the semiconductor sector as a whole, rather than an individual company. When U.S. chip stocks move strongly, the psychological effect often carries over to Korean chip stocks the next day. That said, remember that the SOX mixes companies of different character, such as design, equipment, and foundry, so it doesn't always move in the same direction as memory-centric domestic companies.
5. Downstream Demand: PC, Mobile, Server, AI
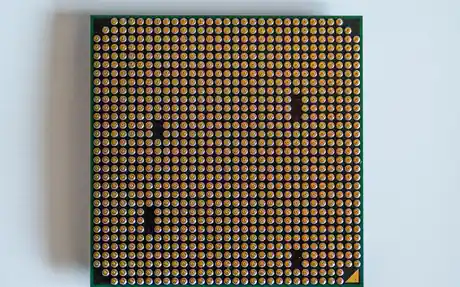
Because semiconductors are components that go into final products, demand for those products (downstream demand) is the fundamental driver. It's broadly divided into PCs, smartphones (mobile), data centers (servers), and AI. The reason AI and server demand is emphasized so often in recent information is that these fields require large amounts of memory. When reading downstream demand, it's important to distinguish "which application's demand is rising and which is sluggish." Even if one segment is good, if another is sluggish, the overall picture can change.
6. CAPEX: Capital Expenditure
CAPEX is the investment a company spends on expanding production facilities. Because semiconductors are an industry requiring large-scale investment, the scale and direction of CAPEX foretell future supply. If the industry as a whole increases investment, supply can rise a few years later and become a factor pushing prices down; conversely, if investment is cut, future supply can grow tight. In other words, the point of interpretation is that CAPEX is an indicator for reading "the future supply environment," not "the present." Because it takes time for supply to increase, you should also factor in the lag between an announced investment plan and when it actually turns into supply.
7. Exchange Rates: A Variable That Seeps into Earnings
Because domestic chip companies have a high export share, they are affected by the won-dollar exchange rate. Generally, when the won is weak (the exchange rate is high), there's an aspect that works favorably for export companies' won-denominated revenue. That said, opposing effects also exist, such as the cost of importing raw materials and equipment and the perspective of foreign investors, so it's hard to judge earnings from the exchange rate alone. It's appropriate to treat it as one of many variables to reference.
Common Misconceptions
- "If one indicator is good, the stock rises too." An indicator is just a piece of the industry picture, and the stock price is also driven by other variables such as already-priced-in expectations, the macro environment, and supply-demand.
- "Low utilization or inventory is definitely bad." Production cuts and inventory adjustment can actually be supply adjustments meant to defend prices, so you have to look at direction and context together.
- "If the SOX rises, domestic stocks go the same way." There is a psychological linkage, but because the constituent companies differ in character, they don't always match.
- "If the spot price rises, earnings improve right away." What connects directly to earnings is mainly the contract price; the spot price is a highly volatile reference indicator.
Frequently Asked Questions
There are so many indicators. What should a beginner look at first?
There's no set right answer. That said, the important habit is reading the different pieces in a complementary way. For example, if you tie price (contract price), inventory, and downstream demand together and understand them as the flow of "demand-supply-price," the context of individual news items falls into place. The key is not to rely on any single indicator.
Where do I check the current values of these indicators?
Memory prices, inventory, and the like are covered by market research firms, each company's earnings releases and disclosures, and brokerage materials. Because the figures keep changing, use this article's explanations only as "how to read," and verify actual values directly against the latest primary sources at the time of release.
Can I predict a stock's direction by looking at the indicators?
No. Indicators are a tool for understanding industry conditions, not a means of predicting a guaranteed future. The market holds many already-priced-in expectations and unpredictable variables, so no combination of indicators can definitively determine a stock's direction.
This article is for informational purposes only and is not a recommendation to buy or sell any particular stock. Investment decisions and their consequences rest with the investor.
All content is fact-checked under our editorial standards.