
How to Judge a Company's Performance: 3 Financial Statements for Beginners
Reading stock or corporate news, you often run into expressions like "revenue grew but profit fell" or "the results are good but cash is drying up." To interpret such sentences on your own, you ultimately need to be able to read financial statements. Financial statements feel intimidating, but the essentials are captured in three tables. This article is a guide to help beginners understand those three in broad strokes.
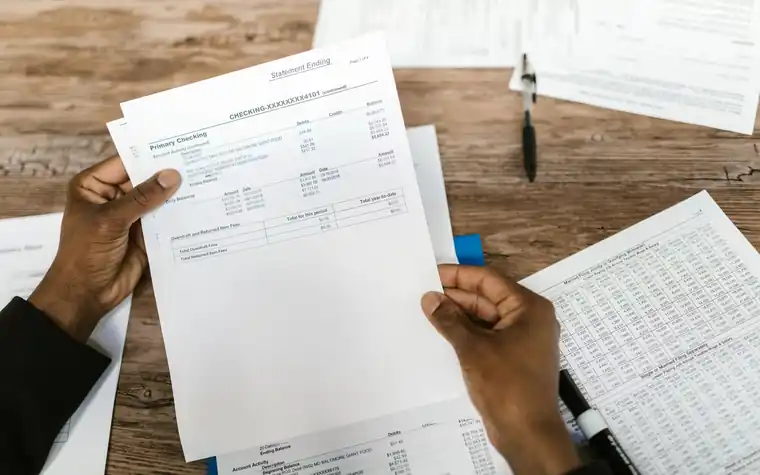
The Three Siblings of Financial Statements: These Three Reveal the Big Picture
A company's report card is broadly divided into three tables. Because each looks from a different angle, it's hard to grasp the company's whole picture by looking at just one.
- Income statement: A table showing how much was earned and how much was spent over a given period (a quarter or a year). In school terms, it's "this semester's grades."
- Balance sheet: A table showing, at a specific point in time, what the company owns and how much, and how much it owes. It's "a list of assets at this very moment."
- Cash flow statement: A table showing how much cash actually came in and went out. Because book profit and the actual flow of money can differ, this table is important.
The Income Statement: The Staircase from Revenue Down to Profit
The income statement is a staircase structure where you subtract costs one by one as you go from top to bottom. For a beginner, just remembering this order is enough.
- Revenue: The total the company earned by selling goods or services. It shows the company's size and growth pace.
- Gross profit: Revenue minus cost of goods sold. It's what's left after excluding the direct costs of making the product.
- Operating profit: The profit actually left from the core business. It's the value after also subtracting selling and administrative expenses such as labor and marketing costs, and it's the key number for gauging a company's "real business ability."
- Net profit: The final profit after settling everything, including taxes and interest. It connects to the final share that goes to shareholders.
A concept often used here is margin (profit ratio). The representative one is the operating margin, operating profit divided by revenue. Even with the same revenue, a company with a higher margin earns money more efficiently. You need to look at revenue growth and margin together to read situations like "revenue grew but the margin worsened."
The Balance Sheet: What You Have and What You Owe
The balance sheet is built on the simple formula assets = liabilities + equity. Assets are everything the company owns (cash, inventory, plants, equipment, and so on); of that, the portion borrowed from others is liabilities, and the portion that is purely shareholders' is equity. Here, if the debt ratio (liabilities divided by equity) is excessively high, the interest burden and financial risk grow. That said, the appropriate level differs by industry, so the rule is to compare within the same industry.
Another thing to watch is inventory. When products don't sell and pile up in the warehouse, inventory rises, and in cycle-sensitive industries like semiconductors, the inventory level can become a signal for gauging the next quarter's results. Since the balance sheet is a snapshot at a specific "point in time," it's good to also look at the flow, comparing with the previous quarter to see how assets and liabilities have changed.
The Cash Flow Statement: Profit and Cash Are Different
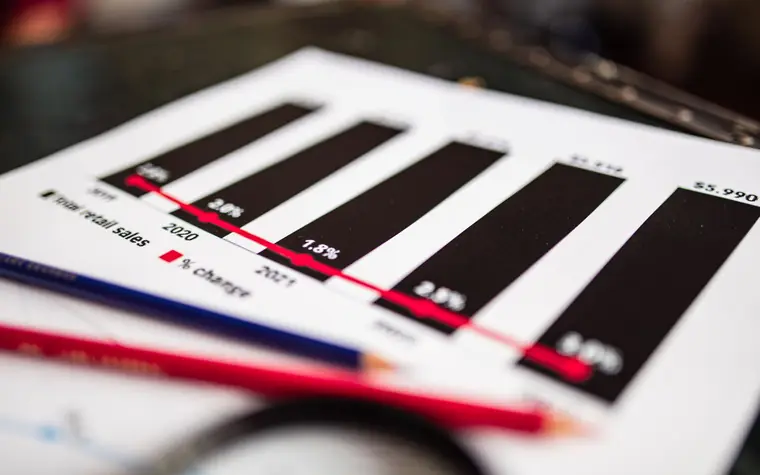
This is the table beginners are most likely to overlook. That's because even when there's a book profit, money may not actually have come into the bank account. For example, if you sell a lot of goods on credit, revenue and profit are recorded but the cash hasn't come in yet. The cash flow statement is broadly divided into three parts: operating, investing, and financing activities. In particular, whether operating cash flow, cash steadily earned from the core business, is stably positive is an important signal of the company's stamina.
Conversely, negative cash flow from investing activities may not be a bad signal. For a company spending (investing) money on plants and equipment, it's natural for this item to show up as negative. In the end, the key is not to judge each of the three items as good or bad in isolation, but to combine them and read which phase the company is in.
What to Actually Watch in an Earnings Release
The points the market focuses on in the quarterly earnings release are set.
- Revenue and profit growth: Whether it grew or shrank compared with the same quarter last year and with the immediately preceding quarter.
- Margin change: Whether the profit ratio is improving or worsening.
- Guidance: The company's own outlook for future results. More than the number itself, the direction weighs heavily on the stock price.
This is where the terms earnings surprise (results far better than the market expected) and earnings shock (results far short of expectations) come from. The important point is that even good results can send the stock down if expectations were already higher, and even bad results can send it up if they weren't as bad as feared. In other words, more than the results themselves, it's "relative to expectations" that moves the market.
When looking at the results of large chip companies like Samsung Electronics or SK Hynix, the perspective is the same. You read the direction of revenue and operating profit, the margins by segment, and the industry outlook the company describes in connection with one another, rather than judging good or bad from a single quarter's number. You need the habit of always verifying specific results against the original text of the electronic disclosure (DART) or the company's IR materials.
Common Misconceptions
"If revenue grows, it's definitely a good company." No. If a company spends excessively to grow revenue, its margin can actually worsen. You have to look at revenue growth and margin together.
"Since there was a profit, cash must be plentiful too." Book profit and actual cash are different. Even with a profit, if cash flow stays negative, you need to examine the funding situation.
"If results are good, the stock will surely rise." Market expectations are already priced into the stock, so how much it exceeds or falls short of those expectations often matters more.

Frequently Asked Questions (FAQ)
Where can I look at financial statements?
For domestic listed companies, you can view quarterly and annual reports for free on the Financial Supervisory Service's electronic disclosure system (DART). It's also good to consult the IR materials on the company's website. You can check summary figures on brokerage apps or portal finance pages too, but it's safest to cross-check exact values against the original disclosures.
Of the three, which should a beginner look at first?
The easiest order to understand is: first look at the income statement to see whether the company makes money (revenue and operating profit), then the balance sheet to see whether debt is excessive, and finally the cash flow statement to see whether cash is actually circulating. The key is to view the three tables connected together, not separately.
Which is more important, operating profit or net profit?
You should look at both. Operating profit shows the core business's ability, while net profit shows the final result after reflecting taxes, interest, and one-off gains and losses. If net profit spiked in a particular quarter, it's good to check even the footnotes for whether one-off factors are mixed in.
This article is for informational purposes only and is not a recommendation to buy or sell any particular stock. Investment decisions and their consequences rest with the investor.
All content is fact-checked under our editorial standards.